In today’s digital age, where information is abundant and attention spans are fleeting, the need for effective communication is more crucial than ever. Infographics have emerged as powerful tools for conveying complex information in a visually appealing and easily digestible format. Whether you are a marketer, educator, or business owner, choosing the right infographic template is key to creating content that resonates with your audience. Let’s delve into the comprehensive guide on selecting the perfect infographic template that suits your needs.
Infographics have become a staple in content creation, providing a visually captivating way to communicate ideas and data. They serve as an effective medium to break down intricate concepts and statistics, making information more accessible and engaging for a diverse audience.
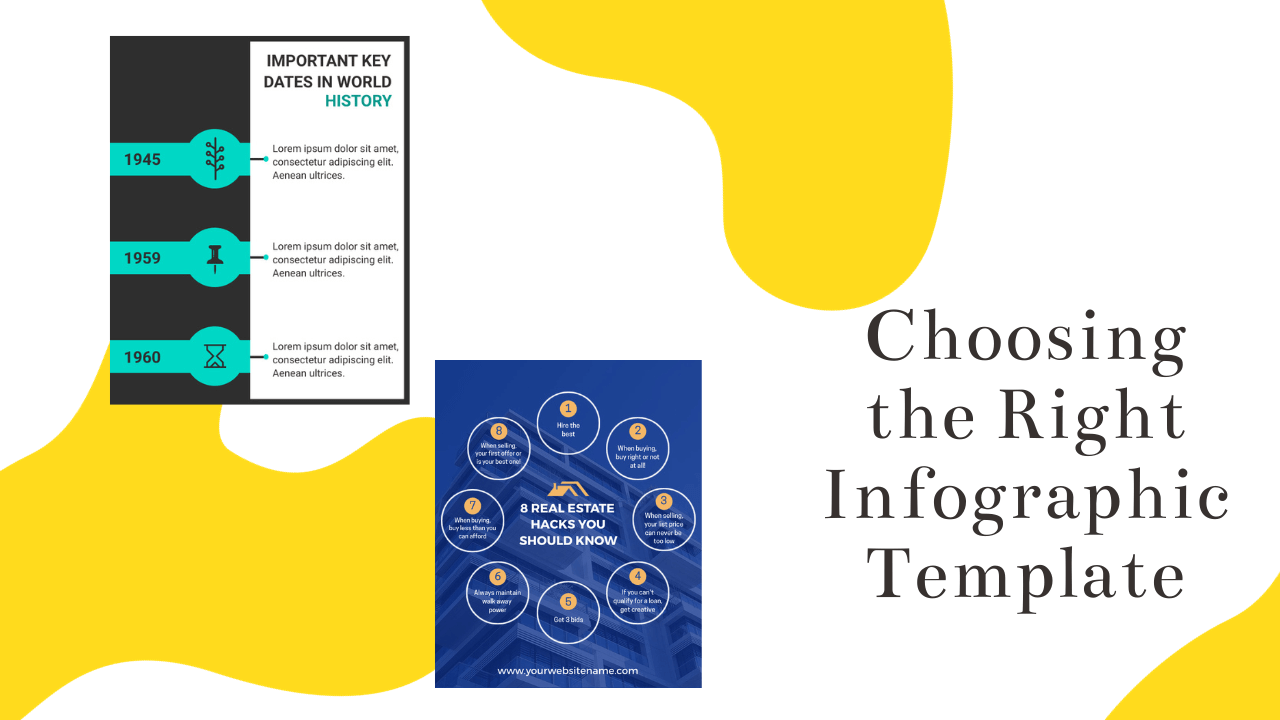
Choosing the Right Infographic Template
Visual Appeal and Engagement
Humans are inherently visual beings, and infographics leverage this by presenting information in a visually stimulating manner. The use of images, icons, and colors captures attention and encourages viewers to explore the content further.
Simplifying Complex Information
Infographics excel at simplifying complex data sets or lengthy information into bite-sized, understandable chunks. This is particularly beneficial when dealing with statistics, processes, or comparisons.
Increased Social Media Shares and Website Traffic
The shareability of infographics on social media platforms contributes to increased visibility and website traffic. The visual nature of infographics makes them highly shareable, leading to a broader reach and potential virality.
Understanding Different Infographic Styles
Infographics come in various styles, each serving a specific purpose. Understanding these styles will help you choose the one that best suits your content goals.
Statistical Infographics
Statistical infographics focus on presenting data and statistics in a visually appealing way. They are ideal for showcasing survey results, research findings, or any data-driven information.
Informational Infographics
Informational infographics aim to educate and inform the audience on a particular topic. They often include step-by-step processes, explanations, or detailed insights on a subject.
Timeline Infographics
Timeline infographics provide a chronological representation of events or processes. They are effective in storytelling and are commonly used in history, project timelines, or company milestones.
Process Infographics
Process infographics break down complex procedures into easy-to-follow steps. They are valuable for instructional content, guides, or any content that involves a sequence of actions.
Comparison Infographics
Comparison infographics highlight the differences or similarities between two or more entities. Whether comparing products, services, or concepts, this style allows for clear contrasts.
Pros and Cons of DIY Templates
Pros:
- Cost-Effective: Creating your own infographic can be budget-friendly, especially if you have design skills or access to free design tools.
- Control and Flexibility: You have complete control over the design elements, allowing for customization based on your preferences.
- Quick Turnaround: DIY infographics can be created on-the-fly, making them suitable for time-sensitive projects.
Cons:
- Limited Design Expertise: If you lack design skills, DIY infographics may not achieve the polished and professional look you desire.
- Time-Consuming: Crafting an infographic from scratch can be time-consuming, particularly if you’re new to the design process.
- Risk of Inconsistency: Without design expertise, there’s a risk of inconsistent visuals and a lack of cohesiveness.
Pros and Cons of Professional Templates
Pros:
- Professional Quality: Professional templates are created by experienced designers, ensuring a polished and visually appealing result.
- Time-Saving: Using pre-designed templates can significantly reduce the time required to produce a high-quality infographic.
- Access to Expertise: Professional templates often come with built-in design principles, helping you achieve a more effective and engaging layout.
Cons:
- Cost Factor: Hiring a professional designer or purchasing premium templates may incur costs, which could be a limitation for some individuals or small businesses.
- Less Customization: While professional templates offer a solid foundation, there may be limitations in terms of customization compared to a DIY approach.
- Dependency on External Sources: Relying on templates means you may have to adapt your content to fit the available designs, potentially limiting your creative freedom.
Optimizing Infographics for SEO
To ensure your infographic gets the attention it deserves, it’s crucial to optimize it for search engines. Follow these SEO best practices:
- Adding Alt Text and Image Descriptions: Include descriptive alt text for your images to make your infographic accessible to individuals with visual impairments. Also, provide a concise image description.
- Including Relevant Keywords: Identify and incorporate relevant keywords related to your infographic content. This helps search engines understand the context and improves discoverability.
- Ensuring Mobile Responsiveness: With an increasing number of users accessing content on mobile devices, optimize your infographic for mobile responsiveness. This improves user experience and SEO rankings.
Infographics in Different Industries
Infographics find applications across various industries, enhancing communication in unique ways.
Healthcare
In the healthcare sector, infographics simplify medical information, making it easier for patients to understand complex procedures, treatment plans, and health statistics.
Technology
Tech-related infographics can explain intricate processes, compare products, or showcase technological advancements in a visually appealing manner.
Education
In education, infographics aid in visual learning, presenting facts, historical timelines, or scientific concepts in an engaging format.
Business and Marketing
For businesses, infographics are powerful tools for marketing campaigns, presenting data analytics, or explaining product features in a compelling way.
Tools and Software for Creating Infographics
Choosing the right tools is crucial for creating stunning infographics. Consider your skill level and project requirements when selecting from the available options.
Online Tools for Beginners
- Canva: An intuitive and user-friendly tool with pre-designed templates and drag-and-drop features.
- Piktochart: Ideal for beginners, Piktochart offers customizable templates and a straightforward design interface.
Advanced Software for Professionals
- Adobe Illustrator: A professional-grade tool for detailed and intricate infographic designs, suitable for experienced designers.
- InDesign: Adobe’s InDesign is versatile, offering precision and control for creating complex and visually striking infographics.
Cost-Effective Options
- Easel.ly: A cost-effective option with a range of customizable templates for creating visually appealing infographics.
- Venngage: Balancing user-friendliness with advanced features, Venngage is a budget-friendly choice for various infographic needs.
Tips for Creating Effective Infographics
Creating an effective infographic requires attention to detail and a strategic approach. Consider the following tips:
- Keep it Simple and Focused: Avoid information overload. Stick to a central theme or message to maintain clarity.
- Incorporate a Call-to-Action: Guide your audience on the next steps, whether it’s visiting a website, sharing the infographic, or exploring further content.
- Testing and Optimizing: Gather feedback and analyze performance metrics. Make necessary adjustments to enhance the effectiveness of your infographics.
Measuring Infographic Success
Determining the success of your infographic involves monitoring key metrics and user engagement.
- Analyzing Social Media Engagement: Track likes, shares, and comments on social media platforms to gauge the reach and impact of your infographic.
- Monitoring Website Traffic: Use analytics tools to assess the influx of traffic to your website or landing page following the release of your infographic.
- Gathering Feedback and Making Improvements: Act on user feedback and data insights to make continuous improvements. This iterative process enhances the effectiveness of future infographics.
Common Mistakes to Avoid
As you embark on your infographic creation journey, steer clear of common pitfalls that can diminish the impact of your visual content.
- Cluttered Design: Overloading your infographic with information can overwhelm viewers. Maintain a clean and organized layout.
- Lack of Clear Message: Ensure that your infographic conveys a clear and concise message. Ambiguity can lead to confusion and disengagement.
- Ignoring Copyright and Attribution: Respect intellectual property rights. Provide proper attribution for images, icons, and data used in your infographic.
Future Trends in Infographic Design
As technology evolves, so does the landscape of infographic design. Stay ahead of the curve with these emerging trends:
- Integration with Virtual and Augmented Reality: Infographics may move beyond two-dimensional displays, incorporating virtual and augmented reality for a more immersive experience.
- Real-Time Data Updates: Dynamic infographics that update in real-time based on changing data provide a fresh and current perspective.
- Personalized and Customizable Infographics: Tailoring infographics to individual preferences or demographics enhances engagement. Expect more tools and platforms to offer customizable options.
Conclusion
Choosing the right infographic template involves considering various factors, from design elements to intended use. By understanding the diverse styles, formats, and dimensions available, you can create infographics that effectively communicate your message. Whether you opt for a DIY approach or enlist professional help, the key is to optimize for SEO, cater to your industry’s specific needs, and continuously refine your design based on feedback and analytics.